The Five Focusing Steps, the Green Curve and the Red Curve. Part 1
03 January 2016, Oded Cohen
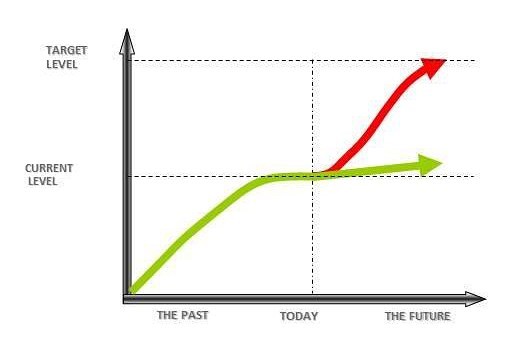
This graph with the green and red curve belongs to the core of TOC. It is embedded in the logo of TOCPA. It represents the motto of Ever Improve way of managing systems, it shows the point in which managing the constraint is critical for the future of the system, and more messages.
Recently, we have had discussions with some TOC practitioners that expressed some frustration about the progress of their implementations. They claimed that while the first part of the TOC project produced outstanding results within a few months, the continuation of the growth was not as rapid and not as easy as they have expected it to be.
Actually, they have not realized that they have just experienced being on the Green Curve, and hence were not aware of the reasons leading to this situation, nor to what is needed to be done and what is the way ahead.
I think that not enough attention has been paid to the graph and the way the graph is linked to the five focusing steps.
The first appearance of the green-red graph was in 1983. In was drawn by Eli Goldratt when we were discussing the continuous improvement of the performance of the companies that implemented OPT. There were many implementations in which the rate of improvement slowed down and even stagnated after having remarkable start. The graph of their performance was marked with a green marker – it has been referred thereafter as the “green curve”. There were few other implementations that continuously improved the performance of their systems. The graph presenting the desired POOGI was marked with the red marker. Both curves referred to our experience with world-wide implementations of DBR.
Even though OPT was the software to manage constraints in the flow – the formalization of the five focusing steps came only in 1986. The five steps helped to understand the underlying reasons for the green curve behavior.
Every logistical solution of TOC starts with implementing the first three steps of the five focusing steps: Identify, Decide how to Exploit, and Subordinate. These steps together are called: “getting your house in order”. As such, the first part of the TOC solution is “stop doing the wrong things”. This on itself brings significant benefits to the system. The system at the outset is ineffective and the first three steps squeeze the maximum of the system. Usually, the lack of effectiveness causes losing throughput and unnecessary operating expenses. Therefore, the first three steps bring reduction in OE and in Investment (by reducing stocks), and in many cases increase in Throughput.
The TOC Way of managing systems is focusing on managing the flow. The flow is governed by the constraint. Identifying and singling out the constraint bring immediate results. For the logistical solutions of TOC: MTO, MTA, DTA and CCPM there are ready made, proven procedures how to carry out the first three steps. Hence, significant results have been achieved within a few months of the implementation. The service industry has been using the TOC logistical solutions by adapting the procedures to their specific environment. In all cases, the first three steps build a robust managerial system that provides the base for the growth of the system.
Moving to the fourth step of focusing is more challenging.
Step four states: Elevate the system’s constraint(s)
Usually, we can state that while the system is under the first three steps, management is using every opportunity to achieve more throughput they can get their hands on. This is a natural part of step2 – “decide how to exploit”. Step four is needed when the system is unable to generate more throughput. The system needs more orders from the market, and this is not always simple.
Step four has no standard TOC solutions. The solution is developed specially for every system using Thinking Processes (TP) with the view of generating market offers that bring value.
Step four demands the active participation of several functions within the organization – marketing, sales, production and logistics – to develop the solutions, to experiment with them and continuously come with innovative ideas. This is challenging conceptually, operationally and organizationally. It demands rigorous thinking, persistence and patience.
Published by Oded Cohen, 03 January 2016
So does the green curve represent the first part of 5FS and the red curve the second part?
Response to comment – 4/1/16
The Green Curve represents the natural progression of a company that grows. It has two and sometimes three consecutive parts:
1. Continuous growth
2. Slowdown of the growth until it comes to (nearly) stagnation
3. In some cases the system may experience deterioration in the performance
The role of management is to ever improve the performance of their systems. As such they continuously search for ideas and solutions to keep the system growing. When they find and implement a new solution that grows the system we may see a green curve on top of the previous green curve.
Implementing a TOC solution starts with the first three steps and hence we can expect to see a green curve of the system performance. Every TOC solution has embedded part for POOGI – process of Ongoing Improvement. This is to ensure that the solution is properly implemented and is exploited for the benefit of the system. However, there comes a point in time that the rate of improvement slows down and the second part of the green curve is experienced. As such it makes sense to state that the green curve represents the first three steps.
When moving to step four the expectation is that the solutions employed bring significant improvement, and hence the system experiences improvement. And, as every idea has its own lifetime, there will come a period of slow down and stagnation. This means that also step four is subject to green curve behavior.
So, what is the Red Curve?
The Red Curve provides the motto – the desire for continuous improvement, driven by the strong belief that the system can have significantly higher performance and at the same time knowing that finding new solutions may be challenging.
The question “So does the green curve represent the first part of 5FS and the red curve the second part?” has triggered my thinking in the following direction:
1. Can one say that the first three of the 5 Focusing Steps is a natural process that steadily growing companies follow intuitively, even without knowing TOC?
I believe if a system is growing nicely and bringing the desired results, it says that the system is ‘doing it right’. In other words, the owner/manager of the system intuitively does right things – they intuitively know the constraint, decide how to exploit it and know how to make sure that their decision is adhered to. The Five Focusing Steps were formulated as a result of rigorous cause and effect. In effect, they were formulated, or ‘recorded’ based on the understanding of the role of a constraint. It is due to this understandng of how systems operate, they became the breakthrough guideline for successful management, and now allow the compaies that do not have the intuitive knowledge still ‘do it right’.
2. If the company has been successful and kept growing for a considerable period of time – does it mean that they have recognized the point in time when they needed to apply Step 4 ‘Elevate’ (even if they did not hear about TOC and the 5 Focusing Steps), or does it mean that they are still on the first three steps? Would this knowledge be of any practical value?
3. If the company learnt and started using TOC and as a result showed dramatic improvements – does it mean that the company has exercised three of the five steps and should expect a slow-down?
My thinking is that if a company knows TOC, is conscious about the progression they are having, is following the ‘Build-Capitalize’ concept, and knows how to recognize the signals of a starting slow down, they should be consciously checking which step they are on to prevent the slow-down.
A comment from Sadashiv Pandit, Executive Chairman, Fleetguard Filters Private Limited, India
Oded,
I will specifically narrate our approach.
As you have rightly said, first three steps give a big benefit to the organization, within a small period of time.
While we approach the third step, it is better to write the SnT [Startegy and Tactics Tree] as it properly guides the organization for build,capitalize and sustain.
Now when we move to SnT culture, we have to work on the competitive edge and keep additing ’sufficiencies’ to it.this is what we have done and this has helped in adding additional T [Throughput].
Our customers want new products with better technologies and that is where the opportunity for ’sufficiency’ is generated.
Again, the guiding principles are ’top management time’ as a main constraint and do not take undue risk.this pushes top management to focus on adding sufficiencies to the DCE [Decisive Competitive Edge].
Our meaning of red curve is …we run faster than the market.(profit and sales)
One of the company using TOC complained to me that TOC is not for ‘job shops’. When I analysed their business model, I realised that after implementing DBR, they failed to use ‘capitalize’ block of SnT, (in fact their TOC consultant did not know SnT).I feel SnT makes you rooted in TOC culture of red and green.
Please let me know if you need any more details.
A very happy new year to all.
I have a somewhat different perspective on the need for active participation of everybody.
In a case when the constraint is internal and a robust managerial system has been put into effect the increased effectiveness exposes hidden capacity causing the load on the capacity constraint to reduce even when volume increases. The system constraint moves external, not enough orders, before it is necessary to invest in elevating the internal constraint. This is stated clearly in the 5th step, “if in any of the previous steps, the constraint is broken, identify the new system’s constraint and repeat the process”. We now have to repeat exploiting and subordinating to this new constraint and it does now require the active participation of everybody involved in the flow to subordinate to customer demand as the bottleneck. If effective, demand will grow if the market is not limited. This is the challenge.
Elevation decisions, investments, are necessary to ensure that the system constraint remains external, to ensure continued controlled growth while capitalizing on exceptional service. This is the concept of maintaining demand as the chosen bottleneck for the system that Eli hinted at when he explained the meaning of the “warning!!!!” in the 5th step.
This is in line with the Sadashiv Pandit’s comments. Running faster than the market.
Hello, Philip,
Thank you for the message, but from my 30 years’ experience in highly challenging automotive market (and my company IMI, former EPIQ, losing no net profit during automotive crisis 2088-2009 – having 92% automotive sales) I would rather prefer to have internal constraint (that is, to have the opportunity to choose sales with nice fat throughput). I would be definitely puzzled to hear a CEO preferring market constraint (that is, gaving no or not sufficient customer orders / demand). Imagine how long he will stay in his soft chair.
Have a great day,
Ognyan Vasilev
When the constraint is in the market that means we properly deliver to all our current clients. When the constraint is inside the company means there are some clients we cannot deliver properly. What do we prefer?
Alejandro, not necessarily “when the constraint is inside the company means there are some clients we cannot deliver properly“.
When we have an internal constraint it means we consciously leave some of the money on the table – as we cannot take those orders because we do not have capacity to exchange it for this money.
The internal constraint does not necessarily mean that we jeopardize our commitment to the client. In Step 2 we decide how to exploit. This is the step for planning the constraint. The rest of the resources are subordinated.
On the planning stage the calculation is made of what quantity we should take in orders for a specific period of time and where is the line that we must not exceed.
Remember Plant10 in G-Sim? With PROPER management by the end of the week we can deliver all units that we have calculated as most beneficial from the point of view of T/CU. The rest of system was subordinated.
The result: all units delivered and Throughput is maximized.
I believe Ognyan speaks about this scenario.
With the constraint inside the company, the company certainly leaves some clients not served (the same way as you cannot buy a plane ticket when the flight is full).
Also, the fact of the market constraint does not necessarily mean that the company perfectly services all clients. There are many sad cases when the company has the market constraint and is still late with the deliveries, with getting back to a potential client with quotations, or turns down orders that could and should have been accepted.
Thanks Jelena. If you have an internal constraint that means you have not enough capacity to serve all the market that asked you for an order. If is external it means that you have enough capacity to serve all the market that asked you for an order. The worst situation is when you do not manage properly to deliver properly in any of both cases. As you mentioned, “With the constraint inside the company, the company certainly leaves some clients not served (the same way as you cannot buy a plane ticket when the flight is full)”
Hi Philip,
These are my thoughts about your statement “Elevation decisions, investments, are necessary to ensure that the system constraint remains external, to ensure continued controlled growth while capitalizing on exceptional service.”
By saying “elevation decision” linking it to “esuring that the system constraint remains – do you mean to elevate internal capacity to ensure that the constraint is kept in the market?
If this is the case, then elevating capacity is not step 4 “Elevate the constraint” (because the constratint is not the capacilty, but the market).
In this case elevating capacity will be Step 3 – Subordinate everything to the market constraint, especially if the capacity is elevated prior and in anticipation of the growth of the market demand, thus keeping the capacity always exceeding the current demand. This is still step 3 of managing market constraint. Generally, what to do in this step is known and solutions are standard along the lines of ‘watch the behavior of the constraint and the non-constraint resources through buffer management, and take actions to keep subordinating the system to the constraint’. Thus, the system keeps itself within the first three steps.
Step 4 of managing market constraint will be when we have exhausted (without wasting) all current market demand. Then the question arises – how to bring more orders? I support Oded’s view that in most cases this will be a customised solution and developing and implementing it will require involvement of many functions.
Looking the green and red curve I wonder about thinking – and remembering Eli Goldratt presentation – that red curve is growth and green curve is stability, and how it can generate a conflict. Grow but lose stability; be stable but do not grow. Then Eli proposed the progressive equilibrium as the win win solution. We are talking about the same graph?
Alejandro asks: “are we talking about the same graph?”
The answer is yes and not really.
Yes, we are talking about two curves, one is green and one is red and the shapes of these curves are similar. However, the discussions around them have different focus. The graph that I was referring to is about the evolution of some typical improvement initiatives (including TOC implementations). The graph that Alejandro refers to is dealing with the conditions for ever flourishing companies.
I will write part two of this subject and post it on the blog
Thanks Oded for explaining the two meanings of these red and green curves. Thinking that the implementations based in TOC should look always for being an ever flourishing company, maybe we are talking about one common understanding of a POOGI.
Alejandro, thanks.
I believe that a TOC implementation is when a company correctly uses concepts and techniques of TOC to achieve improvement.
In my views it would be incorrect to say that a TOC implementation should ALWAYS look for being an ever flourishing company.
The degree of improvement – the objective of the implementation – is set by the owners of the system or the managers to whom the owners delegate the right to manage the system on their behalf. Whether they put an objective ‘to become an ever-flourishing company’ or anything less ambitious is up to them.
Implementing injections for POOGI comes after implementing injections for getting immediate improvements. Whether actions taken within the injections for POOGI can turn the company into an ‘ever-flourishing company’ (the red curve of the other graph) or not – strongly depends on the external business/economic/technological conditions.