The Five Focusing Steps, the Green Curve and the Red Curve. Part 2
13 January 2016, Oded Cohen
This post is the response to Alejandro Fernandez’s comment to the post The Five Focusing Steps, the Green Curve and the Red Curve -Part 1, on 10 January 2016, that says:
“Looking the green and red curve I wonder about thinking – and remembering Eli Goldratt presentation – that red curve is growth and green curve is stability, and how it can generate a conflict. Grow but lose stability; be stable but do not grow. Then Eli proposed the progressive equilibrium as the win win solution. We are talking about the same graph?”
The Graph that Alejandro refers to is taken from Eli Goldratt’s discussion on the necessary conditions for a company to become “Ever Flourishing”. The graph looks like that:
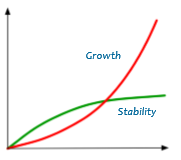
You can see that on this graph the green and the red curves start at the origin. This origin is at the outset of the improvement initiative. It describes two managerial attitudes toward POOGI – Process of Ongoing Improvement. Eli claimed that many managers will prefer the green curve as it is perceived to be more stable and less risky than the red curve. The usual fear of the red curve is that it demands never ending efforts to keep up with the growth. Many managers may elect not to embark on an ambitious journey if they sense a potential negative situation (NBR) in the future.
In the ever flourishing graph both curves describe continuous growth. But, they present different incremental growths (Delta performance) within the same time intervals. While the green curve experiencing decreasing growths, the red curve experience increasing growths.
Based on the finding of “Built to Last”, Eli states that actually companies that have been on the red curve managed to do so because they have had the internal “clock”. This internal clock and the culture of the company provide the stability and the growth.
Reality also shows that there is no stability in the green curve. Once the incremental growth is below the expectation of the owners of the system – management is bound to be under heavy pressure to find ways how to achieve the demanded performance. In the case that management is unable to provide the expected results they are removed and replaced.
The graph has two sections: the first one from the start until the intersection between the two curves and the thereafter.
In the first sections – the overall performance of the red curve is less than the green curve. Why is that?
Our experience has shown that at the outset of the initiative there is a need to Build. The build takes time and investment. Usually, the build demands teaching, training and upgrading of the knowledge, skills, procedures, processes and infrastructure. The full implementation of what is needed for the build may slowdown the achievement of short term results. Hence, the red curve starts slowly and thereafter achieves accelerated results. Trying to achieve short term results by shortcuts and incomplete build causes the inability to maintain the growth and create the green curve.
For over thirty years our message has been consistent: When the company wants to embark on POOGI – our recommendation is to embark conceptually and consciously on the red curve.
In 1983, we discovered the green curve in the OPT implementation. The installation of the software was led by our analysts. Significant improvements in production performance were achieved within few months. However, the rate of improvement slowed down. This was due to clashes with cost based measurements and decision making processes. To overcome these obstacles – the implementation started with intensive management training. These naturally prolonged the times until reaching the short term results. However, the ground was better prepared for the continued growth.
The same message was used in conjunction with the Jonah Program, from 1987 onwards. The TOC implementations started with the Jonah Program. After the ten day program, the Jonah trained their people with the FEW (Functional Education Workshops) and only thereafter, the implementation started. This sequence of activities within the implementation prolonged the achievement of the initial results and created the shape of the red curve as shown in the above graph.
This brings us back to the beginning of the discussion in part 1: dealing with the disappointed managers may feel when after the short period of outstanding improvement they are experiencing the slowdown and even stagnation.
The green curve of the second section (after the intersections) happens due to the inability to perform step 4 of the five steps of focusing or due to the shift of the constraint. The reasons may be the delay in recognizing the slowdown, the inability (lack of knowledge, skills or ideas) to deal with the step or unwillingness of other functions to participate and support.
We can look at the green curve after the intersection as NBR.
As such there is a need to take preventive actions to prepare the system to such scenario. Our recommendation contains:
- The proper implementation of all the injections of the TOC solution used
- The use of Buffer Management for recovery actions while managing the flow
- The use of Buffer Management for POOGI
- Always have the knowledge and plan for next steps of the implementation: Capitalize after build, Sustain after Capitalize, and the next expansion while on Sustain.
Published by Oded Cohen, 13 January 2016
Trackbacks & Pingbacks
[…] Read Part 1 13 January 2016, Oded Cohen This post is the response to Alejandro Fernandez’s comment to the post The Five Focusing Steps, the Green Curve and the Red Curve -Part 1, on 10 January 201… […]
Leave a Reply
Want to join the discussion?Feel free to contribute!